Proprietary 3D visualization web dashboards written in Python
Fully interacitve and customizable
Custom data analytic tools
3D visualization of geologic and geophysical data in the past has required expensive commercial software. I have built fully interactive 3D dashboards using the open-source python programming language. These dashboards can be built in near real time from a variety of complex geologic and geophysical data. Because they are custom, they can be tailored to the data types available for each project. The dashboards are deployed to the web and can be accessed from anywhere with an internet connection and without having to install specialized software. They have simplified controls, which allows for even non-technical people to be able to use .
Other custom python applications have been written for data analytics, data conversion, and even data acquistion via web scraping. Some of these application will be made available via GIthub in the near future. A few of these applications include: LAS file read / write and analyze, directional survey / position log calculator, log plot and rose diagram plotter.
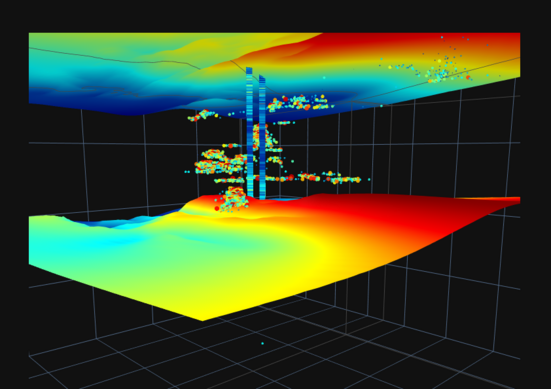
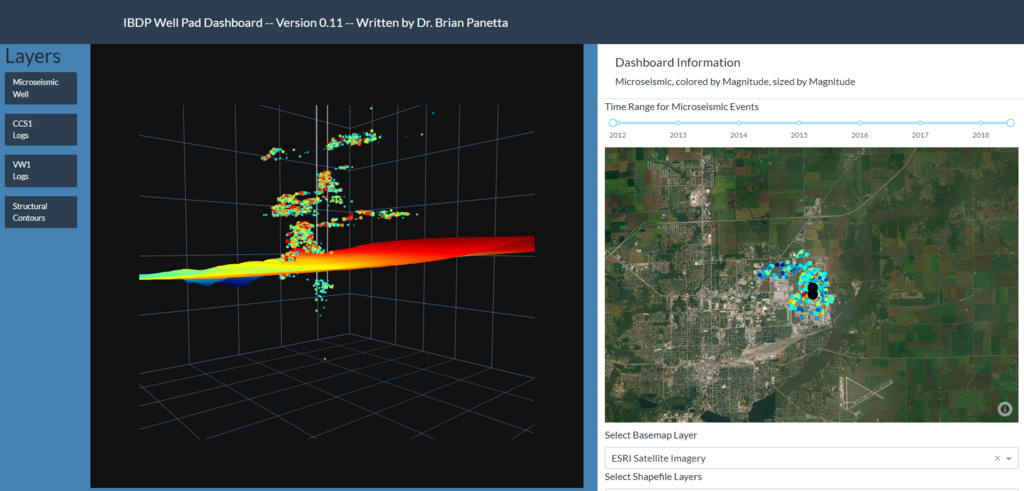
Below are a few of my latest 3D Visualization projects that you can explore. The Boggess project is a dashboard of 6 horizontal Marcellus wells from West Virginia. The Illinois project is a from a carbon sequestration project with two vertical wells, a CO2 well and a monitoring well. The microseismic data tracks the plume movement over a period of six years.
The projects reside on a Heroku basic account. Once you click on one of the projects, it will take you to the Heroku site. Be patient, the application takes 30-60 seconds to wake up and load the first time. These 3D visualization dashboards are fully-interactive. You can turn layers on and off, and filter the data.
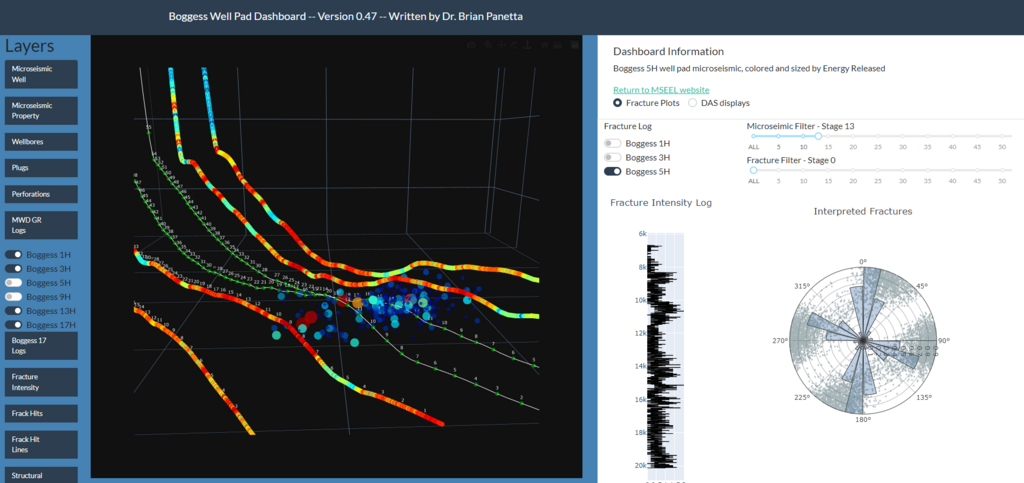
The Boggess dashboard is the most complex dashboard available for demonstration. Below is a list of data type and plots used in the application.
*Open Hole Logs
*MIcroseismic data
*MWD logs
*Completion Plugs
*Completion Perforations
*Completion Frack Hits
*Fracture Density
*DAS / DTS data
*Structural Contour Surfaces
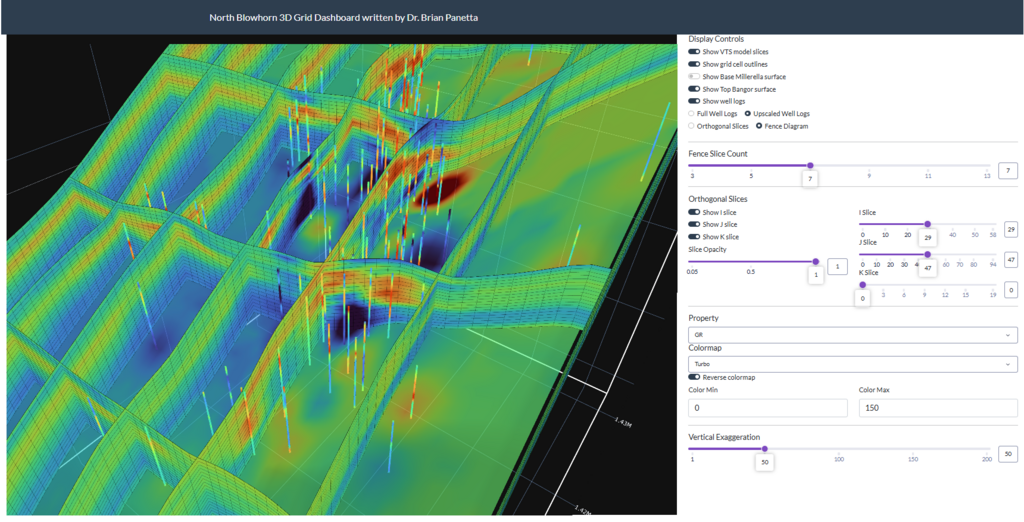
The new North Blowhorn dashboard is a demonstration of a simple 3D geologic model dashboard.
You can slice the model in three dimensions and also view a fence diagram of the model.
Lorem ipsum dolor sit amet, consectetuer adipiscing elit. Aenean commodo ligula eget dolor. Lorem ipsum dolor sit amet.
Lorem ipsum dolor sit amet, consectetuer adipiscing elit. Aenean commodo ligula eget dolor. Lorem ipsum dolor sit amet.
Lorem ipsum dolor sit amet, consectetuer adipiscing elit. Aenean commodo ligula eget dolor. Lorem ipsum dolor sit amet.